The Power of Visualization Tools
Visualization tools are powerful instruments that help individuals and businesses bring their ideas to life, plan effectively, and achieve their goals. These tools encompass a wide range of applications, from simple diagrams to sophisticated software programs that allow for complex data visualization.
Types of Visualization Tools
There are various types of visualization tools available, each serving a specific purpose:
- Diagrams and Charts: Simple yet effective tools for representing data visually, making it easier to understand and analyze.
- Infographics: Visual representations of information or data designed to make complex concepts more digestible and engaging.
- Mind Mapping Software: Tools that help in organizing thoughts, ideas, and information in a visually structured format.
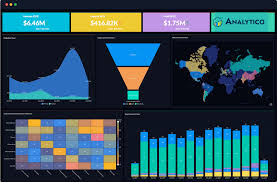
- Data Visualization Software: Advanced tools that allow for the creation of interactive charts, graphs, and dashboards to explore and present complex data sets.
The Benefits of Visualization Tools
Utilizing visualization tools offers numerous benefits:
- Enhanced Understanding: Visual representations help in clarifying complex concepts and relationships.
- Better Decision-Making: Visualizing data makes it easier to identify patterns, trends, and insights for informed decision-making.
- Improved Communication: Visual aids are more engaging and memorable than text alone, facilitating better communication with stakeholders.
- Creative Expression: Visualization tools provide a platform for creative expression and innovative problem-solving approaches.
Applications Across Industries
The use of visualization tools extends across various industries:
- In Business: From strategic planning to marketing campaigns, visualizations aid in presenting information effectively.
- In Education: Visual aids enhance learning experiences by making complex topics more accessible and engaging for students.
- In Healthcare: Data visualization tools help healthcare professionals analyze patient information and trends for improved care delivery.
- In Technology: Visualization software is utilized in analyzing big data sets, creating user interfaces, and designing digital products.
In Conclusion
The power of visualization tools lies in their ability to transform abstract concepts into tangible representations that engage the mind. Whether you are a student looking to enhance your learning experience or a business professional aiming to streamline operations, incorporating visualization tools into your toolkit can lead to greater clarity, creativity, and success in achieving your objectives.
Unlocking Insights: The Power of Visualization Tools in Enhancing Understanding and Communication
- Enhanced understanding of complex concepts
- Facilitates informed decision-making by identifying patterns and trends
- Improves communication with stakeholders through engaging visual aids
- Fosters creative expression and innovative problem-solving approaches
- Makes data more accessible and memorable than text alone
- Applicable across various industries for effective information presentation
Challenges of Visualization Tools: Navigating Learning Curves, Complexity, Costs, and Maintenance
Enhanced understanding of complex concepts
Visualization tools offer a significant advantage in enhancing understanding of complex concepts by transforming abstract ideas into visual representations that are easier to comprehend and analyze. By visually illustrating intricate relationships and data sets, these tools provide clarity and insight that may be challenging to grasp through text alone. This enhanced understanding not only simplifies complex information but also facilitates better decision-making, problem-solving, and communication among individuals or teams working on intricate projects or tasks.
Facilitates informed decision-making by identifying patterns and trends
Visualization tools play a crucial role in facilitating informed decision-making by enabling individuals and organizations to identify patterns and trends within data. By visually representing complex information, these tools make it easier to uncover correlations, outliers, and key insights that may not be immediately apparent through traditional data analysis methods. This ability to discern patterns and trends empowers decision-makers to make strategic choices based on a deeper understanding of the underlying data, ultimately leading to more effective and successful outcomes.
Improves communication with stakeholders through engaging visual aids
Visualization tools offer a significant advantage in improving communication with stakeholders through the use of engaging visual aids. By presenting information in a visual format, complex data and concepts become more accessible and easily understandable to a wider audience. Visual aids not only capture attention but also enhance retention, making the message more memorable and impactful. This clear and engaging communication fosters better collaboration, alignment of goals, and decision-making among stakeholders, ultimately leading to more successful outcomes in various projects and initiatives.
Fosters creative expression and innovative problem-solving approaches
Visualization tools play a crucial role in fostering creative expression and encouraging innovative problem-solving approaches. By visually representing ideas, concepts, and data, individuals are able to think outside the box, explore different perspectives, and come up with unique solutions to challenges. These tools provide a platform for creativity to flourish, enabling users to express their thoughts in a visually engaging manner that sparks new ideas and insights. Ultimately, the ability to visualize information empowers individuals to approach problems from fresh angles and devise creative solutions that may not have been apparent through traditional methods alone.
Makes data more accessible and memorable than text alone
Visualization tools offer a significant advantage by making data more accessible and memorable than text alone. By presenting information in visual formats such as charts, graphs, and diagrams, complex data sets become easier to comprehend and retain. Visual representations engage the audience on a different level, allowing for quicker understanding of key insights and trends. This enhanced accessibility not only aids in decision-making processes but also ensures that the information conveyed is more likely to be remembered over time. Ultimately, the ability of visualization tools to transform data into visually appealing formats enhances communication effectiveness and facilitates better retention of critical information.
Applicable across various industries for effective information presentation
Visualization tools offer a significant advantage in their versatility across diverse industries for presenting information effectively. Whether it’s strategic planning in business, enhancing educational materials, analyzing healthcare data, or designing innovative technology solutions, these tools provide a visual medium that transcends language barriers and simplifies complex concepts. By leveraging visualization tools, professionals can streamline communication, foster better understanding among stakeholders, and ultimately drive more informed decision-making processes across a wide range of fields.
Learning Curve
One significant drawback of visualization tools is the steep learning curve associated with certain platforms. Users may find themselves investing a considerable amount of time and effort in learning how to effectively utilize the features and functionalities of these tools. This learning curve can be a barrier for individuals or teams looking to quickly implement visualizations into their work processes, potentially delaying the benefits that visualization tools can offer. The complexity of some visualization tools may require additional training or resources to ensure users can leverage them to their full potential, adding an extra layer of challenge for those seeking to incorporate visualizations into their workflows efficiently.
Complexity
One significant drawback of visualization tools is their complexity, especially when dealing with advanced features that may surpass basic requirements. This complexity can overwhelm users who only need simple visualization solutions, resulting in confusion and inefficiency in tool utilization. Users may struggle to navigate intricate interfaces, understand complex functionalities, and effectively utilize the tool for their intended purposes. As a result, instead of enhancing productivity and clarity, the excessive complexity of some visualization tools can hinder efficiency and impede users from fully leveraging the tool’s potential benefits.
Cost
The cost associated with certain high-end visualization software can be a significant drawback for individuals or small businesses operating on limited budgets. These sophisticated tools often come with a hefty price tag, making them inaccessible to those who cannot afford the investment. This financial barrier may hinder smaller entities from harnessing the full potential of advanced visualization capabilities, limiting their ability to effectively communicate ideas, analyze data, and make informed decisions through visual representations.
Maintenance
Maintenance of visualization tools presents a significant challenge as it requires regular updates and upkeep to ensure optimal performance. This process can be time-consuming and resource-intensive, demanding attention to detail and technical expertise. Failure to maintain visualization tools properly may result in system glitches, outdated features, and compromised data accuracy. Organizations must allocate sufficient resources and manpower to handle the ongoing maintenance requirements, balancing the benefits of visual representation with the investment needed to sustain their effectiveness over time.